
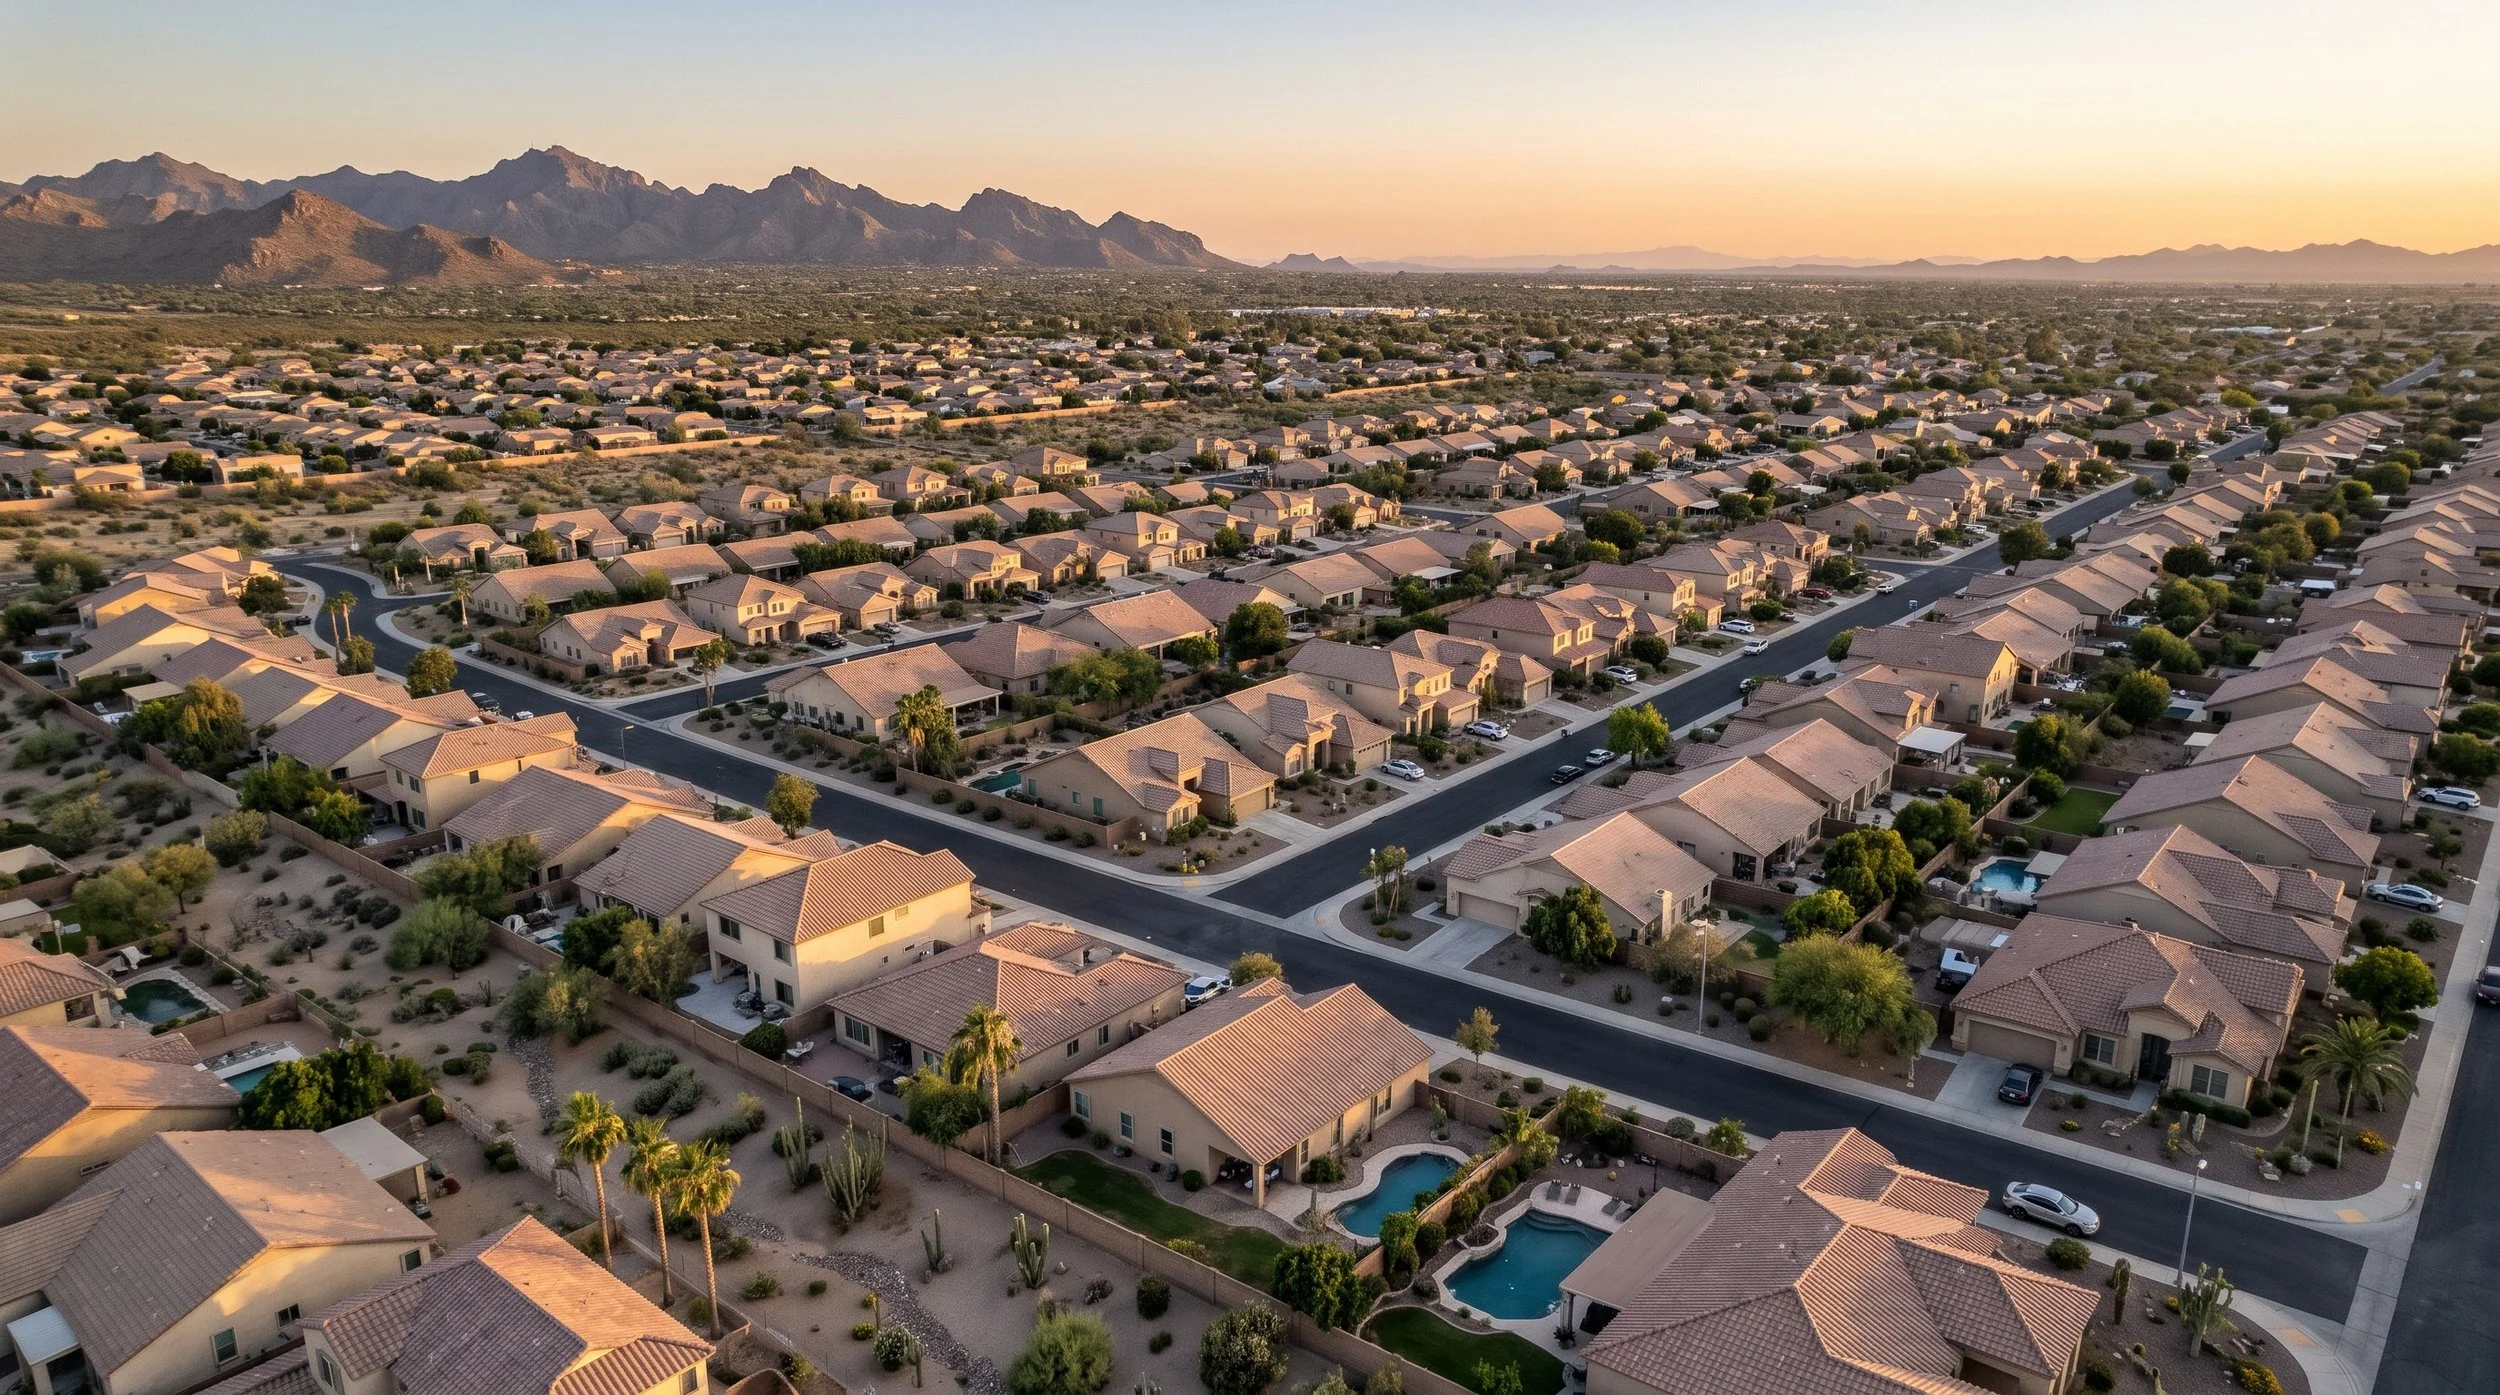
A look at Phoenix's October 2026 housing market: median price, days on market, and inventory, with sourced numbers for buyers and sellers.
If you've been wondering what's actually happening in the Phoenix housing market lately, you're not alone. Headlines swing between "booming" and "cooling" depending on the week, which doesn't help much if you're trying to decide whether now is the right time to buy or sell.
So instead of guesswork, here's what the data actually shows. The numbers below come from the Cromford Report's daily market snapshot for single-family homes, based on Arizona Regional MLS data as of mid-October 2026. Here are five figures worth knowing, and what each one means for you.
1. Median Sold Price: $490,000
The median sold price for single-family homes in the Phoenix area reached $490,000 in the most recent monthly snapshot, up from $475,000 the month before and up roughly 3.3 percent compared to the same time last year. That's a meaningful month-over-month jump, though real estate pricing can move unevenly from month to month depending on which homes close escrow.
What it means: Home values in the Phoenix area have continued to climb modestly year over year rather than falling. If you're selling, that's a reason for cautious optimism. If you're buying, it's a reminder that waiting for prices to drop significantly isn't a guaranteed strategy.
2. Days on Market: 50 Days
The median time a home spent on the market before selling was 50 days, up slightly from 48 days the prior month, but notably faster than the 58 days it took a year ago.
What it means: Homes are moving a bit quicker than they were a year ago, even though the pace has ticked up slightly month to month. Well-priced, well-presented homes in good condition are still finding buyers in under two months.
3. Active Listings: Up 12.1% Year Over Year
Active inventory sat at 3,293 total listings (2,943 when you exclude homes already under contract but still showing as backup-eligible), which is a 12.1 percent increase in available inventory compared to last year.
What it means: Buyers have more options to choose from than they did a year ago. That's good news if you've felt like there was nothing to look at in your price range or preferred neighborhood.
4. Months of Supply: 3.9 Months
Months of supply measures how long it would take to sell through all current inventory at the current sales pace. That number sits at 3.9 months, up from 3.7 the month before and up from 3.2 a year ago. Most agents consider 4 to 6 months of supply a roughly balanced market, with fewer than 4 favoring sellers and more than 6 favoring buyers.
What it means: Phoenix is edging closer to a balanced market after being tilted toward sellers, but it hasn't crossed over yet. That shift is worth watching if you're planning a move in the next six months.
5. Annual Median Price: $485,000
Because Ahwatukee developed in waves from the 1970s through the early 2000s, the housing stock spans a wide range, from modest single-story ranch homes to larger golf-course and mountainside properties with sweeping views.
Final Thoughts
None of these numbers tell the whole story on their own, and conditions can look different depending on the specific neighborhood, price point, and property type you're looking at, whether that's Arcadia, Ahwatukee, or a townhome near Moon Valley. That's where having a local expert who tracks these numbers month to month, and knows how they play out block by block, makes the biggest difference. If you're weighing a move in the next few months, it's worth a conversation about what these trends mean for your specific situation.